
PHP 7.4 preloading benchmark
Preloading arrived to PHP 7.4.0 in November 2019. I was super excited about this and I started to try it out. But I quickly noticed that it was a little buggy when you started with a “real world” application. It worked fine for small hello world apps.
One example of such issues are with class_alias, which is a common practice to
use by libraries that want to provide backwards or forwards compatibility. If you
were trying to preload a file like that, then PHP-FPM failed to start with output
zend_mm_heap corrupted.
PHP 7.4.2 fixed these issues and preloading can finally be used, unless you are running Windows… Preloading in Windows has been disabled in PHP 7.4.2. PHP 7.4.2 will be released the 23rd of January 2020, but the release candidate 1 is available now.
Since preloading hasn’t been stable on a language level until now, there is very little support from the large frameworks. Symfony has done a proof of concept of how it can be used. It was released in Symfony 4.4 and 5.0.
I downloaded and installed the PHP 7.4.2RC1 and tried it out in two applications. One small application and one large.
The applications
| Application | src files | src lines | vendor files | vendor lines |
|---|---|---|---|---|
| Small | 150 | 5.300 | 7.100 | 375.000 |
| Large | 2.500 | 107.000 | 11.200 | 857.000 |
There is quite a big difference in the size of the applications. Both are running Symfony 4.4.
Profiling the small application
Sampling data
So I started by running a baseline by refreshing the page every 5 seconds. When I had enough data I redeployed the application with adding the following line to php.ini
opcache.preload=/var/task/var/cache/prod/srcApp_KernelProdContainer.preload.phpThen I started to refresh the page again to sample data a second time.
The data
The data I got from the production environment looks like this:
| Type | Average response time | Samples |
|---|---|---|
| Baseline | 16,16 ms | 119 |
| With preloading | 15,21 ms | 123 |
| Difference | -5.9% |
This did not look very awesome at all. I was confused at this point. Sure I have a very thin and fast application it may be an edge case. I started profiling my application with Blackfire to see what was going on.
I could see that I spent less time with spl_autoload_call also the call count
was down from 416 to 279. Memory was also down a few megabytes. When profiling, the
response time went from 41,9 ms to 36,2 ms. That is down 14%.
| Type | Average response time | spl_autoload_call |
Memory |
|---|---|---|---|
| Baseline | 41,9 ms | 416 | 3,70 MB |
| With preloading | 36,2 ms | 279 | 2.96 MB |
| Difference | -14% | -33% | -20% |
Profiling the large application
I profiled the large application on localhost. I saw the same trend there. The application’s response time went from 267 ms to 258 ms (-3.3%). I was using a few megabytes less memory.
| Type | Average response time | spl_autoload_call |
Memory |
|---|---|---|---|
| Baseline | 267 ms | 496 | 11,30 MB |
| With preloading | 258 ms | 407 | 8,67 MB |
| Difference | -3,3% | -18% | -23% |
Instead of using Symfony’s strategy to preload, I decided to preload all classes in my src folder as addition to Symfony’s strategy to load all services. That ended up being a bit worse than before but better than the baseline.
| Type | Average response time | spl_autoload_call |
Memory |
|---|---|---|---|
| Baseline | 267 ms | 496 | 11,30 MB |
| With preloading | 258 ms | 407 | 8,67 MB |
| src + services | 264 ms | 304 | 8,19 MB |
Profiling hello world
I decided to profile everybody’s favorite example. A fresh install of Symfony 4.4 with just one controller that returns an empty response.
| Type | Average response time | spl_autoload_call |
Memory |
|---|---|---|---|
| Baseline | 6,30 ms | 29 | 527 kB |
| With preloading | 5.72 ms | 20 | 318 kB |
| Difference | -9,1% | -31% | -40% |
Why these results?
I’ve seen blog posts that says it will be 13% faster when preload hot classes. How come we dont see these results in my tests?
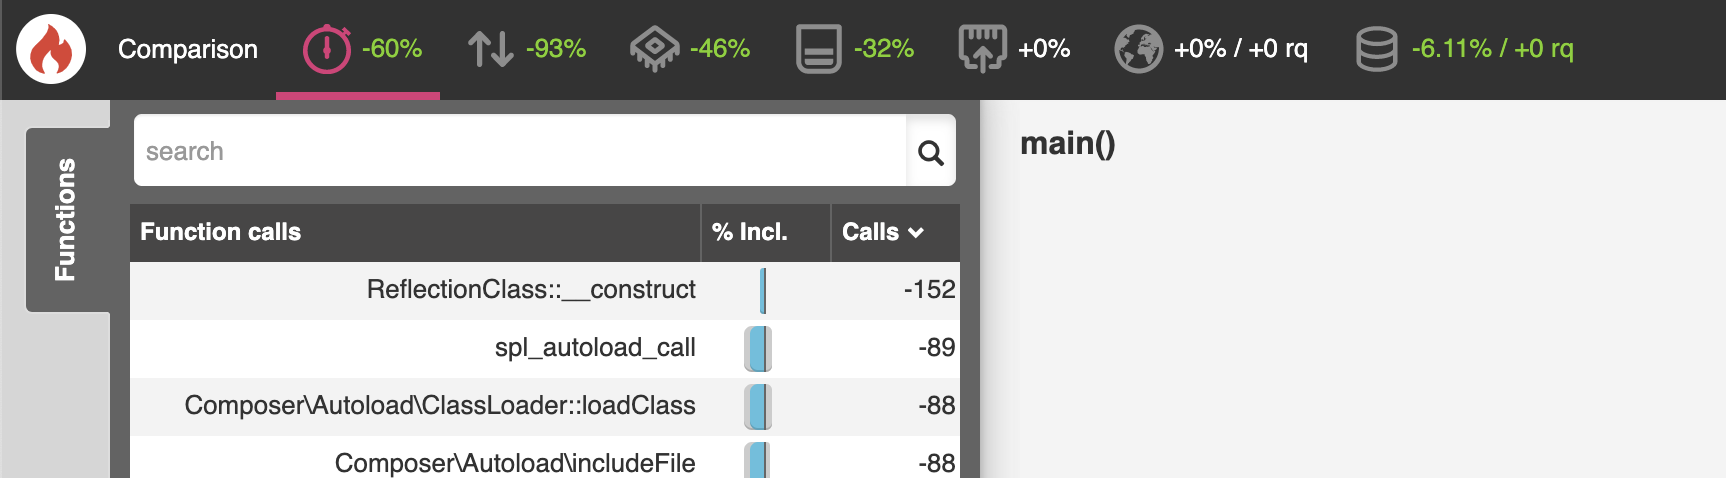
I tried profiling the large application again, but this time without Blackfire’s aggregation enabled. Ie, I was just running the profiler on one page load instead of not normal 10. I wanted to see if preloading made a difference with an empty opcache. And yes, it did.
| Type | Wall time | I/O time | CPU time | Memory |
|---|---|---|---|---|
| Baseline | 1.500 ms | 444 ms | 1060 ms | 26,1 MB |
| With preloading | 597 ms | 38,8ms | 566 ms | 17,7 MB |
| Difference | -60% | -93% | -46% | -32% |
My guess is that opcache could effectively cache most opcodes in my applications. So consecutive runs had a warm opcache which is almost as good as preloading. It will just knock of a few milliseconds.
I also assume that having all warm opcodes like in my tests is a privilege I have as single user on localhost. In production there will be more different page loads and opcache will not be able to keep every class in memory for all requests.
How to improve
To improve performance on the routes that I was doing my measurements on I need to be
a bit smarter with what files I preload. When profiling my large application I still
had about 400 files that was not preloaded (ie, calls to spl_autoload_call).
I will continue to experiment with this at the same time I know Symfony will improve their strategy to be have an even better “out of the box” performance boost.
The future of preloading
I believe preloading is a great feature and its potential will grow beyond what we know today. I’m excited to see what tooling that will be developed around it. But preloading is something that is very application specific. To “preload everything” is not a good strategy. As my reasonable small testing shows, even “preload everything in src” is not a good strategy.
To efficiently come up with the best preloading script you need to make analysis on your applications normal (or important) behavior. I would like third party libraries decide that for me. That is why I dont see future where Composer is helping me with preloading. Composer does autoloading and it does it very well. Preloading is for the application authors.


Leave a Comment